
Cap stcUSD
Live . ethereum . 0x88887bE419578051FF9F4eb6C858A951921D8888
What this vault advertises, against what it actually paid, measured from its own share price on chain over a 30 day window. Everything below is recomputed hourly and every figure on this page comes from the snapshot named at the bottom. Nothing here is typed by hand.
Advertised
5.66%
7 day average
Realized
5.75%
30 day window
Gap
not comparable
advertised on a trailing-7d basis against a 30 day realized window, so no gap is stated.
What Cap published.
"stakingApy7d":"0.05656393366241596"
Figure we recorded
5.66%
Basis
7 day average (trailing-7d)
Label on their surface
7 day average USD APY
Read on
2026-08-31
Age at the end of our window
28.1 days, limit 10
Source
https://api.cap.app/v1/vaults/1/0xcccc62962d17b8914c62d74ffb843d73b2a3cccc/metrics
Open the page we read it from. It is a first-party surface by rule. An aggregator figure is never recorded in this column, whatever it says.
This capture is older than we will difference against a live reading, so no gap is stated above. That is our own staleness, not theirs. Both numbers stay visible with their dates.
Recompute it yourself.
The realized figure is two calls and one exponent. Both calls are pinned to a block height, so they return the same values for you as they did for us, forever. Use any archive endpoint. We deliberately do not name one: a reproduction that runs on our RPC is not a reproduction.
The call
Chain
ethereum
Contract
0x88887bE419578051FF9F4eb6C858A951921D8888
Method
convertToAssets(uint256)
Argument
1000000000000000000 (one whole stcUSD share, 18 decimals)
eth_call data
0x07a2d13a0000000000000000000000000000000000000000000000000de0b6b3a7640000
Returns
cUSD, 18 decimals
The argument is one whole share in the SHARE token's own decimals, which is not always eighteen. Kerne's own skUSD reports twenty four, so calling it with 1e18 returns a millionth of the right answer. Ask the vault for its decimals rather than assuming, exactly as our collector does.
At the start of the window
Block
25857662 (0x18a8e7e)
Timestamp
1787967419 (2026-08-29 01:36 UTC)
Share price returned
1.077387354850340713
At the end of the window
Block
26072704 (0x18dd680)
Timestamp
1790559419 (2026-09-28 01:36 UTC)
Share price returned
1.082348901920439645
Start of window, cast
RPC_URL=... cast call 0x88887bE419578051FF9F4eb6C858A951921D8888 "convertToAssets(uint256)(uint256)" 1000000000000000000 --block 25857662 --rpc-url "$RPC_URL"End of window, cast
RPC_URL=... cast call 0x88887bE419578051FF9F4eb6C858A951921D8888 "convertToAssets(uint256)(uint256)" 1000000000000000000 --block 26072704 --rpc-url "$RPC_URL"Start of window, raw JSON-RPC
{"jsonrpc":"2.0","id":1,"method":"eth_call","params":[{"to":"0x88887bE419578051FF9F4eb6C858A951921D8888","data":"0x07a2d13a0000000000000000000000000000000000000000000000000de0b6b3a7640000"},"0x18a8e7e"]}End of window, raw JSON-RPC
{"jsonrpc":"2.0","id":1,"method":"eth_call","params":[{"to":"0x88887bE419578051FF9F4eb6C858A951921D8888","data":"0x07a2d13a0000000000000000000000000000000000000000000000000de0b6b3a7640000"},"0x18dd680"]}Both calls return an integer in the smallest unit of cUSD. Divide by 10 ** 18 to get the share price printed above. Set RPC_URL to any archive endpoint you trust.
The arithmetic
growth = 1.082348901920439645 / 1.077387354850340713
elapsed = 1790559419 - 1787967419 = 2592000 seconds
annualized = (growth ^ (31536000 / 2592000) - 1) * 100
= 5.7493% (0.460517% over the window)
Simple compounding at the observed rate, on a 365 day year. No fee assumption, no reinvestment assumption, no smoothing. If your arithmetic lands somewhere else, that disagreement is the finding and we want it: liam@kerne.fi.
Cap's right of reply.
Cap did not ask to be measured and has not sent a reply. This slot is open, free, permanent and published unedited, including a reply arguing that our method is wrong. Nothing is charged for it and nothing is offered in exchange.
The terms, and the form, are at the Right of Reply. If the disagreement is about arithmetic rather than framing, the faster door is the checker: send the two block heights and the two share prices you read, and the figure is corrected in public.
Context for this row.
Live and accruing. Cap publishes a 7 day average, and measured over the same seven days our own reading of its vault lands within a hundredth of a point of it. Note for anyone cross checking this row against an aggregator: DefiLlama lists a Cap pool near 7 percent on a different basis, which is not the figure Cap advertises. We score the protocol against its own number.
This protocol publishes a 7 day average and our realized column is a 30 day window, so the two are not directly comparable. We show both and state no gap rather than manufacture one out of a unit mismatch.
This page measures one axis and one only: advertised yield against realized yield. It is not a rating, not an audit, and it says nothing about whether Cap is safe or whether its reserves are what it says they are. A protocol in an announced wind down paying nothing is behaving correctly. The reserve axis is a different page, at the reserve transparency scorecard.
Take this row with you.
This page
https://kerne.fi/honesty-index/cap-stcusdCitation
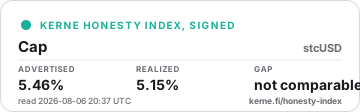
Kerne Honesty Index, 2026-09-28: Cap (stcUSD) advertised 5.66%, realized 5.75% from on-chain share-price growth, gap not comparable (advertised on a trailing-7d basis against a 30 day realized window, so no gap is stated). Source: https://kerne.fi/honesty-index#row-cap-stcusdBadge, markdown
[](https://kerne.fi/honesty-index#row-cap-stcusd)Badge, HTML
<a href="https://kerne.fi/honesty-index#row-cap-stcusd"><img src="https://kerne.fi/honesty-badge.svg?row=cap-stcusd" width="360" height="112" loading="lazy" alt="Kerne Honesty Index: advertised versus realized yield"></a>Row in the API
https://kerne.fi/api/honesty-index/row/cap-stcusd
Where these numbers came from.
Snapshot generated
2026-09-28 01:37 UTC
Snapshot source
live store
Signature
verified, signer 0x84949170e0ad0f9bd8686a4aa4922c10f5fdc4ea
Row key
cap-stcusd
The signature is checked on every render rather than assumed from the presence of a field. A snapshot that does not verify is served with that said plainly instead of borrowing the word.
Board last read 2026-09-28. Every figure on this page is regenerated from https://kerne.fi/honesty-index and none of them is stored in this file.